Aleksandr KLIMENKO
Principal Researcher, MISIS (National University of Science and Technology)
e-mail: nilgpe@mpei.ru
Vladimir KLIMENKO
Head of Global Energy Problems Laboratory, RAS NRU MPEI (National Research University Moscow Power Engineering Institute, Energy Research Institute of the Russian Academy of Sciences)
e-mail: nilgpe@mpei.ru
Aleksey TERESHIN
Leading Research Assistant, Global Energy Problems Laboratory, MPEI,
e-mail: nilgpe@mpei.ru
Olga MIUSHINA
Senior Research Associate, Global Energy Problems Laboratory, RAS NRU MPEI
e-mail: nilgpe@mpei.ru
Introduction
In June 2020, it was 30 years since the day of publication of the First Assessment Report on Climate Changes prepared by the Intergovernmental Panel on Climate Change (IPCC) [1]. The Panel was formed in 1988 through joint efforts of the World Meteorological Organization and the UN, and since that time it prepared fore more Assessment Reports, the last of which [2] came out in 2013–2014. The issue of the next Sixth Report is scheduled for 2022. IPCC activity, although it does not provide any proper studies, nevertheless, it is aimed to provide the global community with the most complete and reliable information throughout the whole range of the relevant problems, appeared to be a remarkable milestone in studying the energy generation industry and the climate interaction, in particular. Many IPCC conclusions regarding this area appear to be highly questionable. On top of that, quite a number of important events have occurred over the past period – it is enough to name the following: The United Nations Framework Convention on Climate Change (1992), the Kyoto Protocol (1997), the Paris Climate Agreement (2015), not to mention the commencement of the global energy transition and the wide-scale distribution of practice for greenhouse gases emission control. Thus, an unusually dynamic situation in the deposit of the energy generation industry and the climate interaction gives us reason to return to this topic again.
In 2020, the average annual concentration of carbon dioxide in the atmosphere has reached 415 mln-1 level, which is an unparalleled event in the Earth geological history, at least, during the last three million years. Last time such high CO2 content in the atmosphere was observed during the Pliocene (9–2 mln years ago), which went along with extraordinary warm climate (with the average temperature by 3 °C higher than the current one) and unusually high ocean level, probably by 15–30 m higher than the current one. Obviously, given the reached warming by 1 °C since the end of XIX century, possibility for returning such conditions worry the world community acutely. At present, it can be well-determined that high concentration of СО2 in the atmosphere and current warming are predominantly the man-made results, due to organic fuel burning mainly [1, 2]. It is quite clear, that the rate of anthropogenic carbon dioxide arrival in the atmosphere, consequently, the speed of further warming is directly connected with the amount of burnt organic fuel and is determined by the fact how the world energy generation industry will develop. In the Fifth Assessment Report IPPC (p. 979, Fig.11.8) [2] it is shown that it is uncertainty of scenarios of man’s impact on the atmosphere, which plays a crucial role in formation of total uncertainty of the future climate changes assessments in the long-term run. Thus, if for the period until 2030, it determines up to 20 % of the temperature simulation assessment span (the remaining part is connected with inherent variability and the features of the climate simulation models), then by 2050 this proportion increases up to 50 %, and exceeds 80 % by the end of the century. As far as the energy production industry impact on climate is very great, it is vitally important to search for long-term trends in its development and to make the well-grounded long-term forecasts.
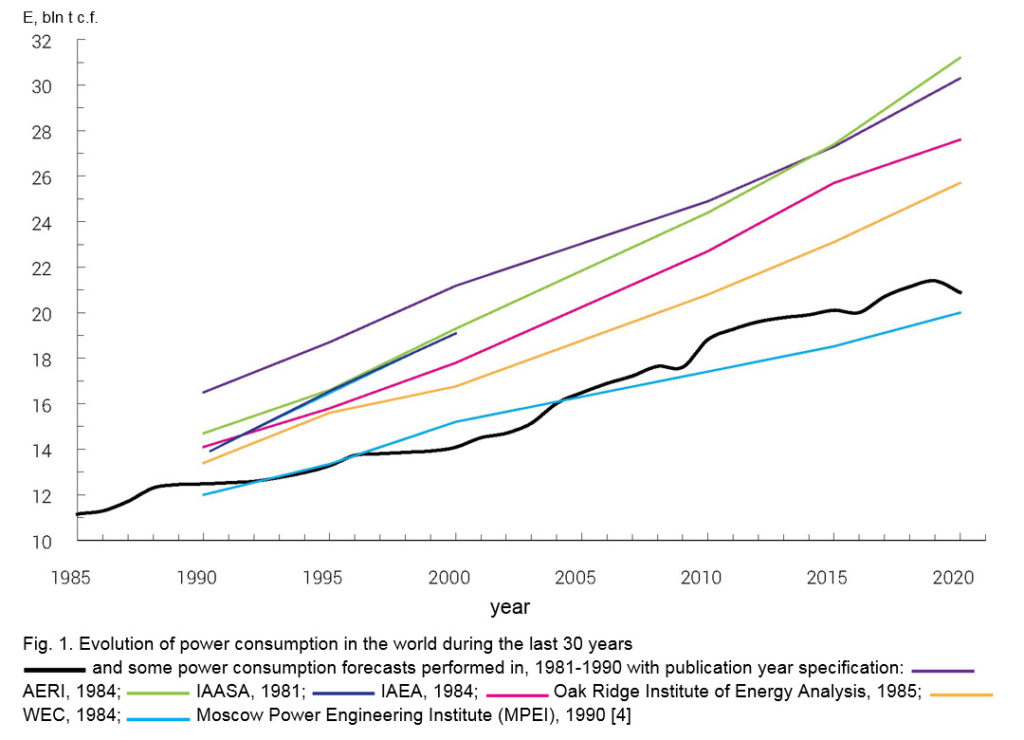
This is not to say that this goal is new, as far as the long-term forecasts appear in the world scientific publications starting from the middle of 70s of the last century, commencing with the Rome club publications and further publications of the International Institute for Applied Systems Analysis (IIASA), International Atomic Energy Agency (IAEA), World Energy Council (WEC), Atomic Energy Research Institute of the USSR Academy of Sciences (AERI) and other institutions (their detailed overview see in [3]). However you cannot but get astonished by the failure level of those forecasts, which, as a rule, start to be wrecked already following 10–15 years after their making (Fig. 1).
As a result, the global energy community is astounded by the total scepsis, with its extreme position lying in the statement that the long-term forecast for energy production industry development is impossible. During the last quarter of a century, this pessimism has also led its way within the community of climatologists, who, instead of the forecasts, prefer using quite spontaneous scenarios [2]. Perhaps, during the last 15 years, from the beginning the most popular were scenarios А1В, В2, and then also RCP8.5 (the first and the last specifically), which exaggerate the man-made carbon emission amount significantly and the climate system response, correspondingly, both at the global and regional level [3]. As a result, already during three decades the world community is constantly provided with misconceptions about the extents of the future climate changes, which causes the unnecessary stress in the society and the exaggerated response. But this not the problem of incorrect choice of scenario – the real problem is that none of offered dozens of scenarios, basically, has any relation to the actual world energy production industry evolution and carbon dioxide emission. As far as the climate system response depends not only on the amount of emissions, but on their dynamics as well, the goal for correct forecast of the world energy production industry development gains quite real practical importance. This article objective is to demonstrate that the genetic forecast method offered by us more than 30 years ago is quite a reliable instrument allowing for predicting the general development of the world energy production industry for many years ahead.
Genetic Forecast of the World Energy Production Industry Development
The historical extrapolating approach widely used in the modern sociology and economy in the form of a well-known theory of institutional changes by Economics Nobel Laureate in 1993 D.K. North is taken as the genetic forecast basis. The main idea of this theory lies in the fact that the complex systems development history determines their future behavior for many years ahead. Consistent application of the genetic approach (detection and extrapolation of historical trends to the future) allowed for formulating two fundamental trends determining the modern way for development of the world energy production industry:
- stabilization of national specific energy consumption per capita at the level mainly determined by climatic and geographical factors [5] (the BP and UN energy statistics data show that this process has been already completed in the most part of the world developed countries [3]);
- steady decline of the carbon intensity in the world energy production industry (carbon dioxide amount per unit of energy consumption) as a result of change in the fuel and energy balance structure during more than 100 years yet.
Implementation of the first trend shall lead the worldwide average specific energy consumption per capita to the values about 2.8–3 t of s.f./yr (this is just a little above the current level), which, with the planet population growth approximately up to 10 bln people by 2100, according to the last assessments of the UN Demographical Information Service, will bring the annual world energy consumption to 28–30 bln t of s.f., which is just by 1.5 times higher than the current on. Thus, the historical approach limits the energy consumption in the current century exactly by this comparatively low-level value. Meanwhile, not too long ago, the authors of many drastic energy scenarios allowed for the growth of the energy consumption up to 60, 100 and even 200 bln t of s.f./yr (see [3]) based on incorrect hypothesis that to reach the standards of living of the developed countries they will require the relative level of energy consumption. This idea is still alive. At that, an important point is left out of consideration that almost all highly-developed countries are located in the middle and high latitudes requiring significant additional expenses for heating (up to 40 % of the total need).
Persistence of the second trend means reduction of the rates of growth in the man-made impact on the climate system. In particular, over the next 15–20 years, it is expected that the peak of the man-made СО2 emission will be at the level of 10–11 Gt C per annum, which does not differ much from the current 9.5 Gt C per annum Steady decline of the carbon intensity can be justified by the fundamental philosophical principle of progressive simplification by A. J. Toynbee widely used in the nature and social life. In respect to energy production industry, this principle manifests in gradual transition from more complex energy carriers “preserved” in the fossil fuel to more simple, the natural ones. Development of the world energy production industry starting from the industrial age complies completely with this principle: from coal to oil, then to gas, and, at last, to unconventional renewable energy sources (RES) – solar, wind,biotic, etc. The global energy transition that has become a new reality during the last decade and accompanied with rapid growth of gas consumption and with even faster RES consumption (at the rate of 12–15 % per annum), represents a clear illustration of this principle implementation.
Comparison of the genetic forecast for development of the world energy production industry made in 1990. [4] and the BP and UN data on the energy consumption over the last 30 years is shown in Fig. 1. You can see that during all this period deviation of the actual data from the calculated data made 3–4 % and reached its maximum 6 % in 2012. The genetic forecast allowed for making an absolutely correct prediction of a sharp slowdown of the annual rates of growth in the energy consumption at the turn of the millennium, which reduced up to 1.8 % in 1990–2020 as opposed to 3.7 % in 1950–1990. This circumstance has become a total surprise for the most part of the analysts, who, at their time, expected for more than double increase of energy consumption during the last quarter of the century. It is demonstrated in Fig. 1, where a few forecasts made in 1980s by a number of highly reputable research institutions are shown (see [3]).
Link: Madrabothair / Depositphotos.com
It is evident that all of them overestimate the global need for primary energy starting as early as from the 1990s, and this contradiction goes on accruing as time passes reaching 40–50 % nowadays (see Fig. 1). Moreover, the forecasts made in 1980s contained a wide range of fundamental nature errors, namely:
1) the assumption that the oil consumption at first, and then the gas consumption will pass over their peaks at the turn of a century due to rapid depletion of the recoverable reserves. In fact, oil and gas production and consumption go on growing, and the maximum of oil production will be reached no sooner than the middle of the current century, and of gas – only in the second half of the current century. Even at the end of XXI the gas consumption, mainly due to putting into operation of the vast unconventional reserves (shale, coal bed methane, tight formation gas), will still be at the current level [6];
2) it was assumed that the nuclear energy industry will challenge the other energy sources, and its proportion in the total consumption will exceed 15–20 % during the first quarter of XXI. In fact, the nuclear energy industry undergoes a protracted crisis, specifically intensified after the accident at Fukushima nuclear power plant in March 2011. For the last 25 years, its annual average growth made negligible 0.7 %, which is significantly less than for any other type of energy. The portion of the nuclear energy industry in the world energy consumption during the same 25 years has dropped from 5.6 to 4.2 %,and there no chances that it may grow substantially during the next 30–40 years. This is expressly enough indicated in the recent IAEA annual report on the nuclear energy industry development prospects (2020), in which, as has always been the case, two scenarios of the future were presented – the high and the low scenario. Taking into account that during the whole 40-year history of making similar forecasts there was not a case for high scenario implementation; it is more correct to rely on the low scenario data, according to which, by 2050, generation of the electric energy at NPGS shall make slightly over 2.9 trln kW·h, which corresponds to the current level practically. It means that NPGS portion in the total energy consumption will go on dropping and will not exceed the same 4 % by the middle of the century;
3) the role of the renewable energy sources (RES) in the foreseeable future was presented inappreciable. Actually, the RES, beyond all doubt, are the most dynamic type of the world energy production industry demonstrating the impressive rates of growth 15–20 % per annum during the last 25 years. In 2020 the electric power plants running on RES have produced 3 trln kW·h per annum for the first time, and during the year before they overcame the nuclear energy industry by the volume of the electric energy production. Within the framework of historical approach, the renewable energy sources (including the hydropower industry) will take the lead in the world power balance already in 20–30 years [6, 7].
Carbon Dioxide Emission and Atmospheric Concentration
Thus, the real energy picture in the world at the beginning of XXI century differs greatly from its representation in the recent scenarios calculated at least for three quarters of the century. It stands to reason that the perceptions based on them about СО2 emission evolution and its concentrations in atmosphere are also too far from reality (Fig. 2).
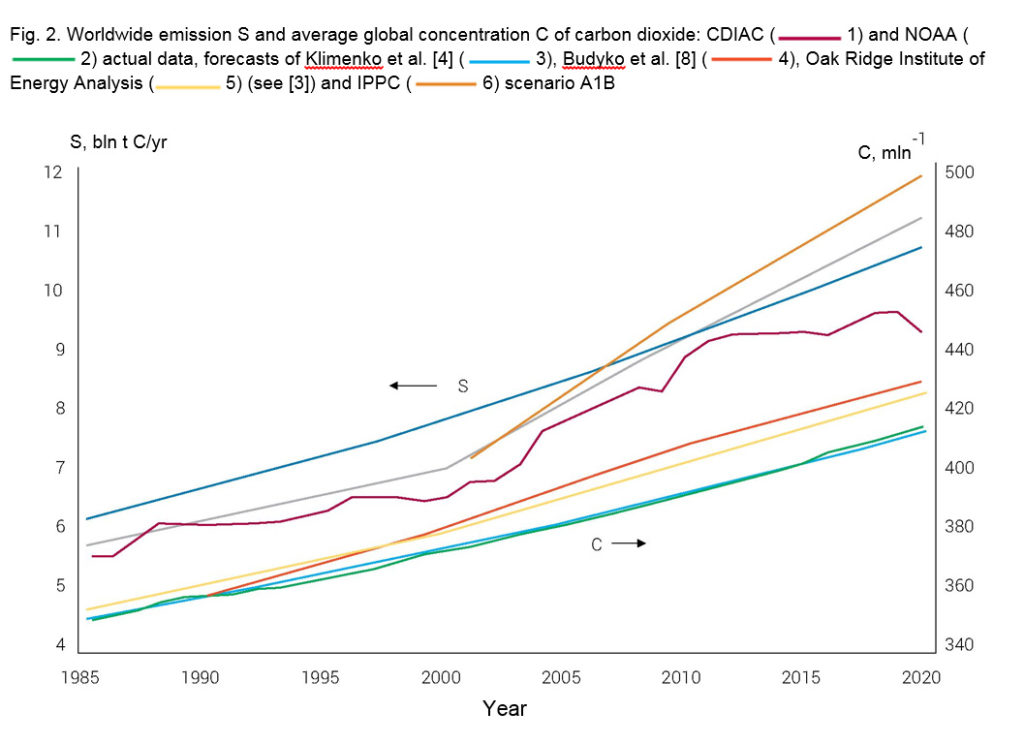
On the contrary, the genetic forecast allowed for predicting very accurately the real evolution of the carbon dioxide emission and concentration during the last quarter of the century. It is СО2 concentration, which is the most important parameter that is used immediately in the air temperature calculations in all climate models, and therefore the accuracy of its determination is critical for similar calculations. Fig. 2 shows that the genetic forecast, without correction, allowed for predicting СО2 concentration during the last 30 years with truly unparalleled high accuracy (the error made less than 1 %), which is equivalent to the error of computation of the average global temperature within the limits of (0.02–0.04)°C with the climate system sensitivity of (1.5–3.0)°C to СО2 concentration doubling.
As far as genetic forecast exhibits an amazing stability and does not require frequent adjustment with the time, it can be assumed that it will demonstrate repeatable indicators, at least during some next decades. In this connection, it is interesting to look at this forecast results until the end of the current century [7]. We believe that the carbon emission growth will stop already in the next decade at the level of 10–11 bln t C per year, than its slow reduction will start. However, as a result of burning significant amounts of coal and unconventional gas, the emission value will be at the level no lower than 6 bln т С / yr also at the end of the century. Based on wide historical experience of the energy production industry evolution and the first decade of the Paris Agreement [7] implementation, the achievement of the environmentally-neutral economy, i.e.with zero net emissions declared by the leaders of some developed countries of the world, seems unreal to us nether by 2050, nor even in the longer term prospect.
From the point of view of climatology, the more important is the carbon dioxide cumulative emission, as far as exactly it determines CO2 concentration in the atmosphere and the radiation forcing of this greenhouse gas. The value of the cumulative emission 228 Gt C for the last 30 years (1990–2019) predicted by us [4] does not differ practically from the real one (227 Gt C) calculated based on BP data. Thus, it is hoped that the error in calculations for carbon emission in atmosphere up to the end of this century will be within the limits of 5–7 %. For comparison, it is worth mentioning that, by 2100, the range of the carbon dioxide cumulative emission according to scenarios of SRES IPPC group makes above 50 % of the median value.
With our conception, the grate of growth for carbon dioxide concentration will be reducing from the current value 0.5 % per annum (according to NOAA data) to 0.3 % at the middle of the century and 0.1 % at the end of it (Fig. 3). The concentration will reach maximum value slightly above 500 mln-1 in the first half of XXII century, after which its slow reduction will start caused by the excessive atmosphere carbon absorption by the ocean and the terrestrial biota, as well as by development of the carbon disposal technologies.
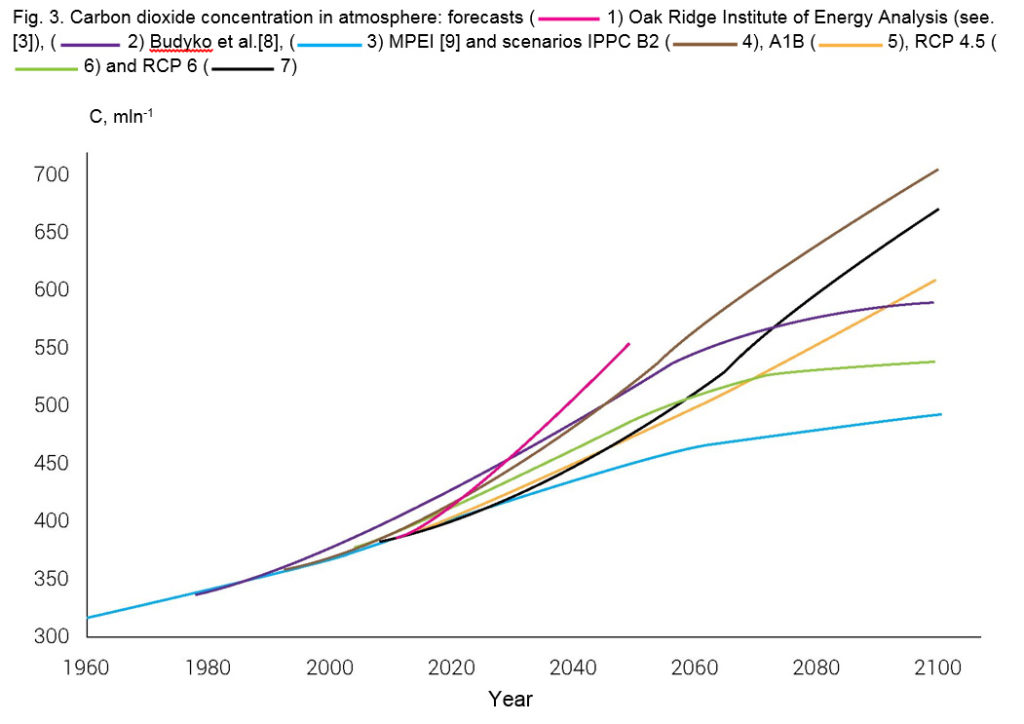
Thus, the genetic forecast gives the results, which lie considerably
lower than those of the less aggressive scenarios for the man-made impact – IPPC [2] (В1 from the second family of SRES scenarios and RCP 4.5 from the recent family of scenarios). This means immediately that the estimations of the future warming require serious adjustments.
Average Global Changes and Natural Climatic Factors
How much such adjustment may be, can be judged by the results of calculations in two models – the IAP (Institute of Atmospheric Physics) intermediate complexity climate model RAS [10] and MPEI regressive-analytical model [9, 11] using different options of the man-made impact – forecasts by this article authors [4–7] and SRES IPPC scenarios [2]. As is seen from Fig. 4, both models give repeatable estimates of the average global temperature change for the period up to 2100 for identical scenarios of the man-made forcing (MPEI and А2 IPPC), while the span of estimates upon selection of extreme scenarios reaches 3 degrees. Thus, it is evident that the validity of the forecasts for man-made impact on atmosphere, firstly, under the action of the energy production industry, also considerably determines the accuracy of calculations for the future climate changes.
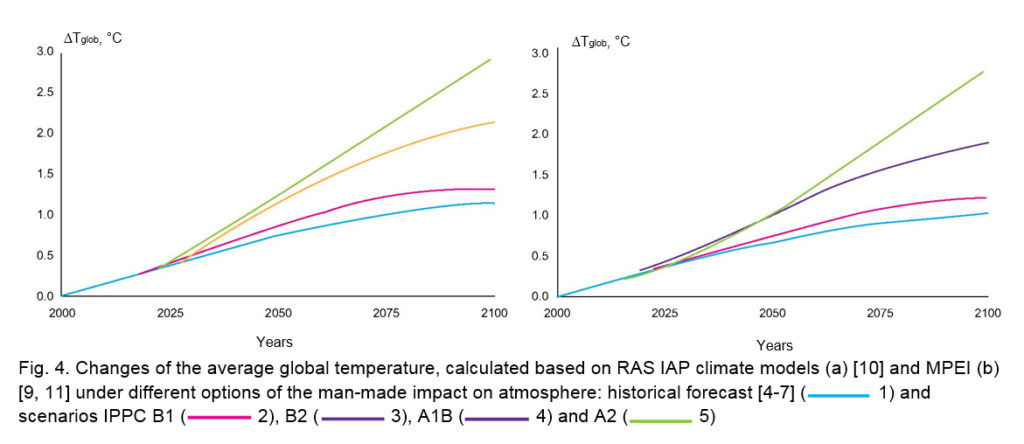
Implementation of the most aggressive scenarios IPPC, such as A1FI, A1B or RCP 8.5, RCP 6.0, from the point of view of historical approach looks improbable and the alarm concerning arrival of the relative consequences looks absolutely unreasonable. Nevertheless, approaching of CO2 concentration to 500 mln-1 does not hold out a hope for opportunity to retain the rise of the average global temperature not only within the limits of 1,5, but also of 2 °C before the end of the current century. The only opportunity to prevent the adverse warming lies in wide use of the carbon disposal technologies. However there are serious doubts, that the disposal extent can reach the required level in the coming decades. Really, the worldwide capacities for carbon dioxide disposal operating at present are assessed by GCCSI at the level of 10 mln tons of carbon per annum (or about 0.1 % of the annual emission), and to prevent the further rise of temperature by 0.5 °C it is necessary to deposit at least 1 bln tons by the middle of the current century and up to 3 bln tons by its end. Scale taken into account economic costs and domineering persistent non-admission of such technologies by the public, it is difficult to presume on achieving fast progress in this deposit.
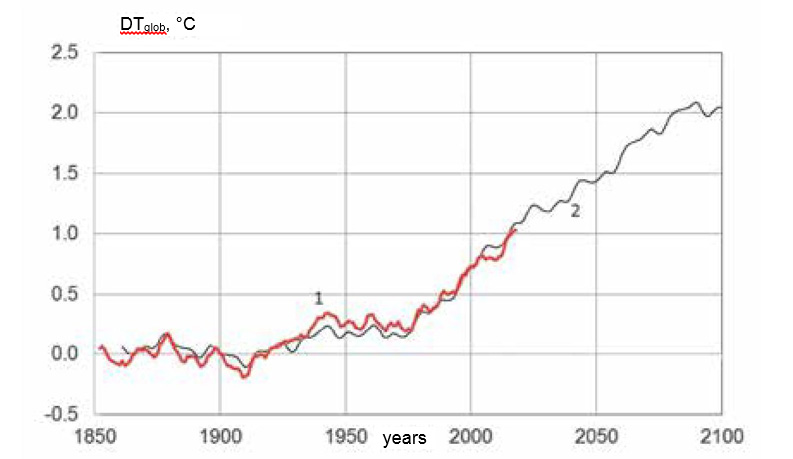
The first decade of the current century finished with quite extraordinary climate event – for the first time after 1970 the average global temperature in the course of five years (2006–2010) was lower than the temperature during preceding five years (2001–2005). In addition, fifteen years running, from 1998 to 2013, the average temperature across the planet failed to grow, and in the Southern hemisphere it was just lowering. In the later science literature, this phenomenon got the name of Small Break (Little Hiatus) (in order to distinguish it from the so-called Big Break ensuing in 1945–1975, a considerably occult phenomenon until today, which has interrupted global warming that has started back at the end of XIX century). The new break have caused true tumult in the scientific community, because it raised serious doubts about man-made origin of current global warming. After all, for 30 years from 1983 to 2013 comprising the Small Break period, the man-made emission of carbon dioxide, the main greenhouse component in atmosphere, has increased by 85 % – from 5.1 to 9.4 bln tons of carbon per annum, and СО2 concentration – from 343 to 395 mln-1. How to explain the apparent global warming rate slowdown in this case?
It is evident that the observed global rise of temperature (Fig. 5) is a result of joint impact not only of man-made, but also of natural factors on the climate system. It is some of the latter that are the reason for climatic paradox in the beginning of this century. Thereunder, we shall try to identify these factors and, based on this analysis, to make the forecast on development of climatic situation in the world for coming decades.
(up to 2025 – 6 years also)
The results of continuous wavelet analysis of global and hemispherical air temperature series during the period of 1850–2020 according to CRU data are presented in Fig. 6. Here, only one of three available and filed in time global temperature archives (HadCRUT4) are analyzed, because at present it is the only one having data covering over 170 years, which is critically important for this study. It should be emphasized that possibility for analyzing such long-duration series appeared only fairly recently, which makes it real to provide search for multidecadal rhythms in them. The long-period man-made trend caused by accumulation of greenhouse gases and aerosols in atmosphere, which was determined by calculations based on MPEI combined climate model (combination of energy balance and statistical models) [9, 11] was removed from the series preliminarily. The residual temperature series obtained in such way, without the removed trend, should contain important information on the impact of natural factors.
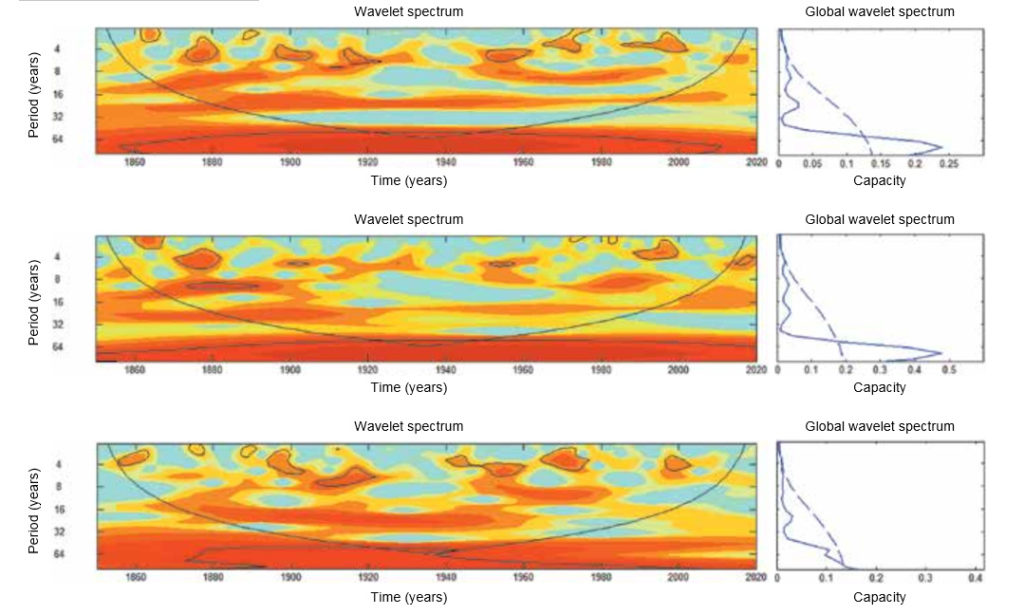
The data in Fig. 6 shows availability of extremely persistent approximately 70-year and 20-year cycles for the whole time of instrumental observations from the middle of XIX century. The less significant 9-year cycle was observed within the longer period (1870–1900 and 1940– 2000), and 6-year cycle – in the significant part of the total period of observations. The similar results have been also obtained when studying the temperature series using the maximum entropy method [12].
It can be assumed that the source of dominating 70-year cyclicity is the Northern Atlantic, where it is steadily fixed not only in the ocean, but also on the continental periphery – in Greenland, on Ellesmere Island, England, Finland, on Novaya Zemlya and Yamal, at that, not only in instrumental data, but also in the series of paleotemperatures and pressure for hundreds and even thousands years. More recently, it was established that 70-year cyclicity zone of influence spreads far to south and covers Golfstream formation areas. We believe that this rhythm is conditioned by quasi-periodic changes of atmospheric and oceanic circulation well-known as North Atlantic Oscillation (NAO) and Atlantic multidecadal oscillation (АМО). Both of these phenomena are tightly interconnected and, even more, represent different sides of the same coin – inherent instability of the global climate system [13–15]. The phase of this instability determines intensity of warm subtropical waters advection to the north and farther into the basins of the Norwegian and the Barents Seas, and, at last, influences the hemisphere and world climate on the whole. Really, the series of AMO/NAO indices contain approximately 60–70-year component [13, 16, 17] and manifest strong positive correlation with the North hemisphere temperature series [15, 18]. We have established that correlation of temperature series with АМО index appears to be more strong.
The eras with positive AMO/NAO indices are characterized by more intensive data, but also in the series of paleotemperatures and pressure for hundreds and even thousands years. More recently, it was established that 70-year cyclicity zone of influence spreads far to south and covers Golfstream formation areas. We believe that this rhythm is conditioned by quasi-periodic changes of atmospheric and oceanic circulation well-known as North Atlantic Oscillation (NAO) and Atlantic multidecadal oscillation (АМО). Both of these phenomena are tightly interconnected and, even more, represent different sides of the same coin – inherent instability of the global climate system [13–15]. The phase of this instability determines intensity of warm subtropical waters advection to the north and farther into the basins of the Norwegian and the Barents Seas, and, at last, influences the hemisphere and world climate on the whole. Really, the series of AMO/NAO indices contain approximately 60–70-year component [13, 16, 17] and manifest strong positive correlation with the North hemisphere temperature series [15, 18]. We have established that correlation of temperature series with АМО index appears to be more strong.
The eras with positive AMO/NAO indices are characterized by more intensive
western disturbance of the air masses and notable warming of the most part of the Northern hemisphere non-tropical zone specifically manifested in winter-spring period. To the point, the most short-term phase of contemporary warming (1975–2005) distinguished by exactly such seasonal asymmetry, which also argues for connection of hemispherical and global temperatures with events in the North Atlantic.
Finally, it appeared that 70-year rhythm is noted in the series of the global temperature and the Northern hemisphere temperature, but is manifested relatively slightly in the Southern hemisphere spectrum, which is an important additional evidence for its North Atlantic origin.
Availability of bidecadel cycle is often attributed to the influence of the Sun, but it’s not all that simple here, because in our case this cycle is hardly manifested in the Northern hemisphere, at the same time it is distinctly seen in the Southern hemisphere. This forces to search for its possible origin not in the Sun behavior only, but in dynamics of the Southern Oscillation (SO), with its index having the peak of 22 years [19]. Over the last years, the point of view has been formed that the Southern Oscillation is an integral part of a more wide-scale phenomenon named Pacific decadal oscillation (PDO), in the spectrum of which the pronounced bidecadel cycle is present. PDO influence spreads to the whole Globe [20], but most particularly itis manifested in the tropical zone. It can be seen, because the temperature series of equatorial and southern parts of Pacific Ocean, as well as of all waters of the Indian Ocean contain pronounced bidecadel oscillation [12]. In its turn, the Southern Oscillation determining considerably the temperature regime of the Southern hemisphere, is undoubtedly under the influence of the Earth rotational rate oscillations, which also have the important period of 22 years [21]. More recently, there appeared quite a line of evidences that the bidecadel cycle is inextricably connected with АМО phenomenon and represents an integral feature of the climate system, persistent during thousands of years [13, 22].
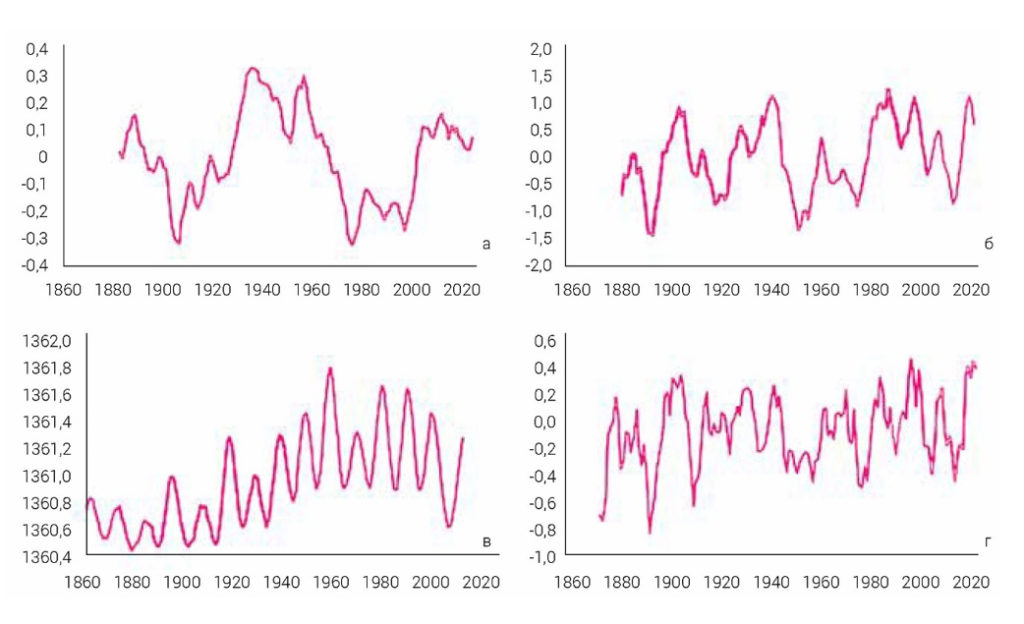
At present, the nature of 9-year cycle seems to be less clear and is seen as a result of adding the lunisolar tides with specific time periods of 8.85 years (lunar orbit perigee period) and 9.86 years (period of Sun-Jupiter system barycenter), which, with no doubt, are able to cause significant changes of atmospheric circulation and, consequently, the air temperature. Comparison of instrumental observation data from 1850 and results of calculations based on energy balance model supplemented with superposition of some main discovered cycles, is given in Fig. 5. The calculated curve in 1850–2020 segment explains more than 75 % of the observed variability and demonstrates clearly that the natural factors may intensify to a great extent or, on the contrary, disguise the progressing warming all the way down to its complete stop or even short-term cooling as it was during the Big (1945–1975) or the recent Small break (1998–2013). We believe that in the coming years the warming will slow down again and will restart only by the beginning of the ne[t decade, but, till the very end of the century, its rates will be lower than those reached during the period of 1975–2005, when coincidence of extremely intensive positive phases of NAO/AMO and PDO/SO (Fig. 7) with the record-breaking levels of the solar irradiance for the last 600 years [23] ensured the warming rates exceeding 0.2 °C per decade. In the coming decade, the natural factors will exercise restraining effect on the process of global warming, which due to, firstly, reduction of solar activity and transition of NAO/AMO to the negative phase, which features for weakening of intensity western disturbance of the air masses. As the data of the recent observations shows, both of the specified processes are gaining strength. Really, the AMO index that has reached the local maximum between 2005–2010 started its lowering and it will enter the negative zone soon. PDO Pacific index has also passed the next maximum in 2017 and, thus, concurrent lowering of both main circulation indices is takin place now for the first time during 60 years (Fig. 7). Cannot but remind you that in the similar situation in 1960 the tendency to the global cooling, which exhibited strikingly in the Northern hemisphere, prevailed. The chance for current warming control increases not least because of concurrently with transformation of circulation processes in the ocean in the recently finished solar cycle 24 (2008–2019), in PMOD/WRC observatory there were recorded the values of solar irradiance density TSI, which are minimum almost for all 50-year history of satellite observations (Fig. 7). The process of solar activity reduction is not completed here – according to our forecasts [24], it should be prolonged for at least two coming solar cycles, i.e. up to 2044.
and SO (d)
Conclusion
The presented results show, in what way the extents of the man’s future impact on the environment can be specified considerably, and they allow for making the following conclusions:
- Development of the world energy production industry does not occur arbitrarily, but under certain laws having historical origin. The historical approach establishes quite a low ceiling
of global energy consumption and carbon emission at the levels of 30 bln t of s.f. and 11 bln т С/yr, correspondingly, i.e. at the level yet lower than for less aggressive scenarios used in climatological calculations. Nevertheless, the scale of greenhouse gas emissions with the implementation of the genetic energy forecast does not prevent a global temperature rise by 2 degrees compared to pre-industrial era. - The world community has no real capabilities to stop the global warming at the level “significantly lower than 2 °C” as the Paris Climate Agreement (2015) prescribes.
- For adequate assessment of the extent of the man-made impact (firstly, on the side of the energy production industry) on the global climate, the natural factors should be taken into account – solar activity and quasi-periodical processes in “atmosphere – ocean” system.
- Slowdown of the global warming through to its temporary stoppage is possible in the coming 10–15 years due to counteraction of natural factors of climate, and then, after 2070, as a result of completing global energy transition and total decarbonization of the energy production industry.