Valery SEMIKASHEV
Chief of laboratory INEF, c.e.s.
e-mail: vv_semikashev@mail.ru
Abstract. The article examines the state of the nuclear power industry at the present stage from the point of view of making decisions on the expansion or reduction of nuclear generation. The role of nuclear power in the energy balance, its pros and cons as a source of electricity, decision¬making schemes for the construction of new power units and possible ranges of this type of generation in the forecast period are shown. The conclusion is drawn about possible approaches to the development strategy of the Russian nuclear industry.
Keywords: nuclear power, demand for electricity, closure of nuclear power plants, nuclear reactors.
The role of nuclear energy
At the present stage of development of the world economy, nuclear energy exists as a significant, but not the leading segment of the world energy. According to the IEA, its share in primary energy consumption in 2018 amounted to about 5%, and its share in the global electric power generation was about 10% (Table 1). As can be seen from the table, these shares have been decreasing over the past twenty years.
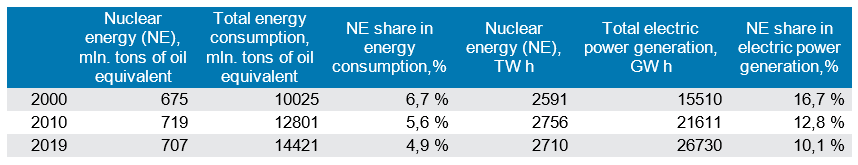
Source: IEA
The dynamics of the share in the global commercial1 energy consumption according to BP statistical review is shown in Fig. 1. The peak of nuclear energy role in the energy supply of mankind, apparently, fell on 1990s. Later, this share has only been decreasing. For the purposes of this article, it is important to note that the absolute values of NPP electricity generation are not growing (Table 1), and the share of nuclear energy in the world energy consumption is declining (Fig. 1).
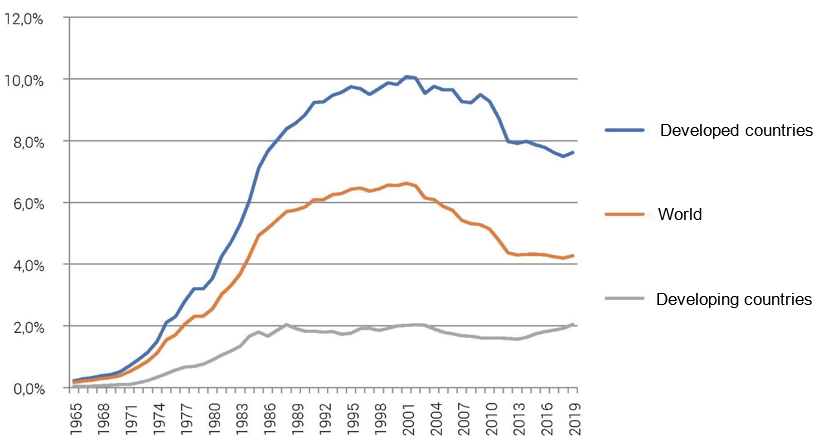
Source: BP statistical review
Fig. 2 shows share of NPPs in electricity generation by countries of the world. Let’s review the current state and development strategies in these countries.
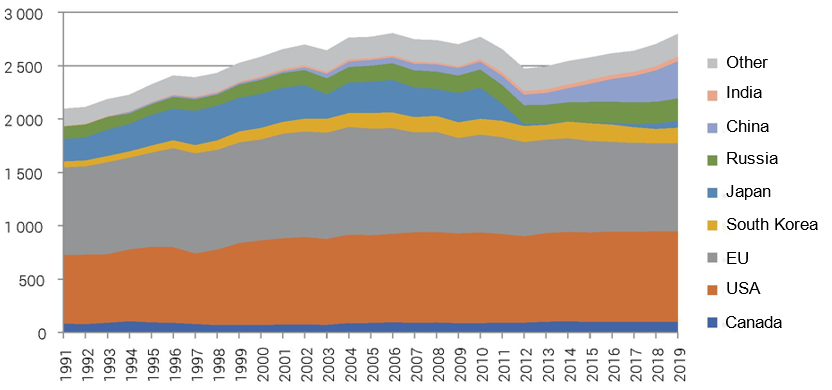
Source: BP statistical review
Currently, 60% of all NPP electricity generation are accounted for by the USA and the European Union. In general, these countries do not plan to expand their nuclear energy. In the EU, Finland, Slovakia and Hungary have strategies of their nuclear energy expansion. In these countries, new power units are under construction or decisions are expected to be made on construction of new power units. They are prompted to build nuclear power plants by two reasons: the need to create conditions for sustainable development of national industry through the efficient and cheap NPPP electricity generation, and plans to reduce CO2 emissions by replacing the fossil fuel generation.
In France, where NPPs have a share of more than 50% in the cumulative generation, they will keep or phase out the share of nuclear power plants in the electricity balance. Some European countries – Germany, Spain, Belgium – decided to phase out all nuclear power plants.
Other major energy producers, as a rule, have their own developed industries and strategies for the development of nuclear energy. These markets are closed for external suppliers. In Canada, South Korea, there will be a gradual increase in NPP generation.
In Japan, after the accident at the Fukushima NPP, all nuclear power plants were shut down. They will gradually resume their work, however, no strategic decision has yet been made on the possibility of replacing the old power units that are close to the end of their service lives with new ones.
As for the developing countries, China has the greatest plans for the development of nuclear energy. By the end of 2019, 45 GW of NPP capacities were installed in the country, while 10 GW were under construction. Most NPPs in China are equipped with pressurized water reactors working in Chinese nuclear plants, but some power plants also use American (Westinghouse), French (AREVA) and Russian (Rosatom) nuclear plants. In the future, China plans to actively use nuclear energy as well to ensure reliable supply of national economy with energy, since this does not lead to local emissions or CO2 emissions. According to forecasts of various organizations (IEA, US EIA, HIS, СNPC), nuclear generation will have a share of 8-10% in the cumulative electricity generation in China by 2040 (now the share of NPPs is about 5%).
Prospects for the development of nuclear power plants in world energy outlooks
Table 2 presents a review of world energy outlooks. For convenience in comparing outlooks for different years with different forecast horizons and base years, the data is presented in the form of average annual growth rates over periods.
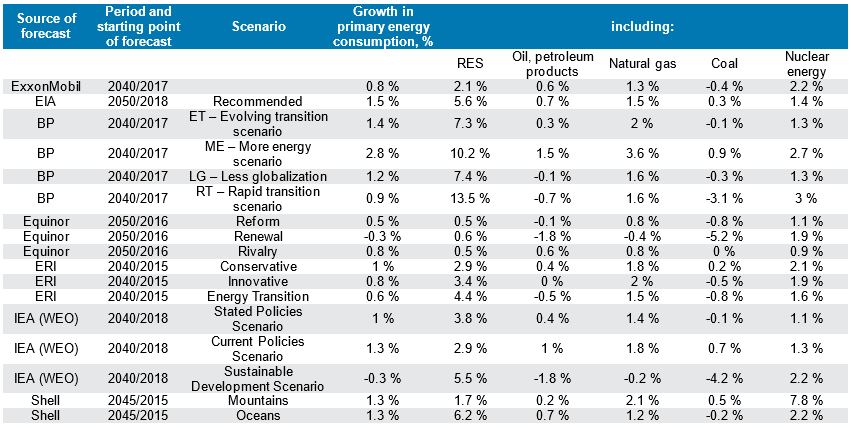
Source: compiled by the author on the basis of [1–9]
On average in most outlooks, the growth rate of world energy consumption is about 1% per year. This corresponds to the scenario of the last 10-20 years. Higher growth rates occur during periods of global economic growth acceleration and during periods of low energy prices.
The role of coal is declining in almost all forecasts. It is being replaced by natural gas and renewable energy sources. Nuclear power is closing the balance. Basically, these are annual growth rates in the range of 1-2 percentage points, which, as a rule, are slightly higher than the dynamics of cumulative energy consumption.
In a number of scenarios, nuclear energy plays a leading role. For example, in the Shell scenario (this scenario is based on the logic that decisions are made in corporations and governments under the conditions of restrictions and risks of international hydrocarbon trade, and not under the influence of markets and communities) the highest growth rate of nuclear energy is presented – 7.8% per year. However, this should be considered as an opportunity or option for the development of world energy in such a specific scenario.
Also, relatively high growth rates are shown in BP scenarios with increased energy consumption or accelerated decarbonisation of the economy – 2.7% and 3%, respectively.
However, in forecasts like this, the nuclear power factor does not play a fundamental role, being rather a closing figure. It is a source of energy, that is the most easy for governments to make decisions, there are no resource constraints for it, and the population’s rejection of this type of energy is always local, it cannot be taken into account in such macroforecasts. Therefore, for the purposes of forming a strategy for the development of nuclear energy and nuclear industry, basing on forecasts like these without associating to specific projects is incorrect.
The economics of NPPs
Nuclear power engineering is characterized by the following technological features (Table 3).
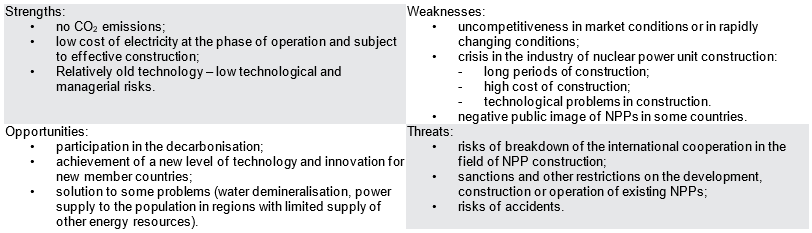
Source: compiled by the author
On the one hand, NPPs provide a potentially low cost of electricity and the ability to solve both environmental problems (including reducing CO2 emissions) and economic problems for a number of countries. On the other hand, for most countries of the world, new NPPs will turn out to be expensive projects with a long investment cycle and high project implementation risks. Thus, currently relevant is the conclusion of a special report of the International Energy Agency made in one of world energy outlooks [10] that the development of nuclear energy will be concentrated in developing countries and in the electricity markets where government decision-making is present. Construction of nuclear power plants can be afforded by countries:
• with a high level of competence in this area (or willing to cooperate with one of the countries with such competence);
• where there is an expectation of sustainable growth in demand for electricity and benefits from the involvement of NPPs in meeting the demand;
• where decisions on investments in the electric power industry are not market-driven.
It is difficult to imagine the construction of new NPP units in other conditions. This restricts the participation of this type of generation in meeting the demand for electricity.
The cost of constructing a nuclear power unit can be simplified as consisting of three main components: construction, power unit and safety systems. Let’s imagine that on average these components each have a share of 30% in the cost. Then the structure and the absolute level of costs for different countries will differ depending on the specifics. The key elements of the high competitiveness of NPPs are low construction cost (cost of construction materials, labor and speed of construction) and access to proprietary technologies for the production of basic equipment for nuclear reactor and safety systems.
According to IEA, specific capital investments in construction of new nuclear power units [11] are in the range of $5–6.6 thousand/kW of installed capacity in the USA and EU2 and $2.6–2.8 thousand/kW of installed capacity in China and India (prices of 2019). For the given specific investment levels, the calculated levelized cost of electricity (LCOE3) will be 10-15 cents per kWh in developed countries and 6.5-7 cents in China and India. These estimates for developed countries exceed estimates of the cost of alternative technologies. However, in China or India they are in the middle, being overtaken by cheaper coal, solar and onshore wind generation, but leaving behind more expensive gas or offshore wind generation.
As for Russia, according to the information available to the author, the cost of construction of PWR-1000 and PWR-1200 units is currently in the range from 250 to 400 thousand rubles / kW of installed capacity. At the same time, the upper limit of the range is reached in the event of delays in the construction and commissioning of the power unit (if it takes longer than 4-5 years). Thus, if calculated in the same way as IEA calculations for a low exchange rate of ruble (90 rubles / US dollar), cost of a modern nuclear power unit will be from $2.5 thousand per kW of installed capacity, while with a high exchange rate of ruble (60 rubles / US dollar) it will be more than $4-5 thousand per kW of installed capacity. At the same time, the decisions on commissioning of new NPP units are made based on the logic of loading the important nuclear industry, and not based on the competitiveness of this type of generation in the Russian wholesale electricity and capacity market.
Analysis of existing projects and commissioning of new NPP units in the world
60 reactors with a total electric capacity of about 56 thousand MW were commissioned over the past 10 years, according to the IAEA (see Table 4) [12].
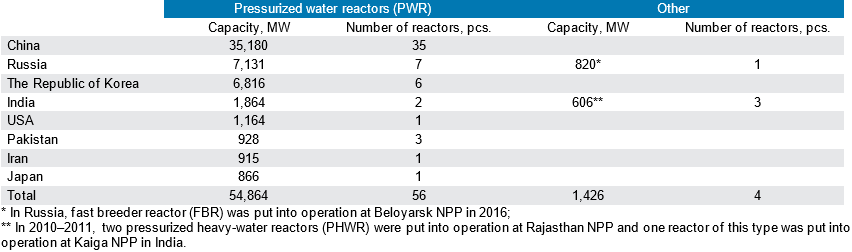
New NPP capacities in the period under review were commissioned in China, Russia, the Republic of Korea, India, Iran, Pakistan, the United States and Japan. Moreover, the first three countries account for 88% of the added capacities, of which 62 percentage points are accounted for by China, 12 percentage points are accounted for by the Republic of Korea and 14 percentage points are accounted for by Russia.
The peak of commissioning (half of all commissioned capacities) was observed in 2015, 2016 and 2018. This is the effect of the accident at Fukushima NPP in 2011. Immediately after it, companies tried to quickly complete the projects they had started so as not to be subject to changes in regulation and tightening of safety requirements.
56 of the 60 commissioned reactors are pressurized water reactors (PWR). 3 pressurized heavy water reactors (PHWR) were built in India and 1 fast breeder reactor (FBR) was built in Russia.
Source: PRIS IAEA 2020
The peak of commissioning (half of all commissioned capacities) was observed in 2015, 2016 and 2018. This is the effect of the accident at Fukushima NPP in 2011. Immediately after it, companies tried to quickly complete the projects they had started so as not to be subject to changes in regulation and tightening of safety requirements.
56 of the 60 commissioned reactors are pressurized water reactors (PWR). 3 pressurized heavy water reactors (PHWR) were built in India and 1 fast breeder reactor (FBR) was built in Russia.
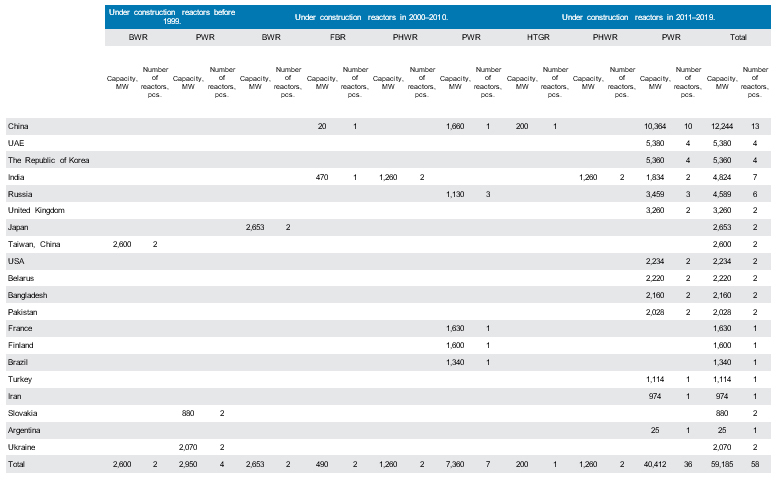
Another 58 reactors with a total electric capacity of 59 thousand MW are under construction (Table 5). The construction of some of them began as early as in the last century, for example, reactors in Ukraine, Slovakia or Taiwan. Among them, commissioning dates are known only for Mochovce-3 and Mochovce-4 reactors in Slovakia. They are planned to be commissioned in 2020-2022.
During the period 2000-2010, the construction of 13 reactors with a total capacity of almost 12 thousand MW began. They are under construction in Russia, India, China, Japan, Turkey, the UAE and Brazil.
In the coming years, it is planned to commission the Olkiluoto-3 nuclear reactor in Finland. In Russia in 2021, another reactor, Leningrad 2-2, is expected to be put into commercial operation (physical start-up and the start of pilot operation took place in 2020). Commissioning of the Angra-3 reactor in Brazil is scheduled for 2026.
In the last reviewed period, i.e. in 2011-2019, the construction of 39 reactors with a total capacity of almost 42 thousand MW was started. The main facilities under construction are concentrated in China, South Korea, India and Russia.
Among the reactors under construction, pressurized water reactors (PWR) also prevail. There are 47 of them. India is constructing 4 pressurized heavy water reactors (PHWR), China is constructing one high-temperature gas-cooled reactor (HTGR), each of the above countries is constructing one fast breeder reactor (FBR), and Japan and Taiwan each have two boiling water reactors (BWR) under construction.
The largest suppliers of commissioned reactors are Chinese companies: DEC, CFHI, NPIC, as well as Russian Atomenergomash (AEM) and Korean DHICKOPC, that provided their countries with reactors. The share of Chinese companies in the total amount of added capacities is as high as 49%, while Russian companies have a share of 23%, Korean suppliers have a share of 12%, supplier from the USA have a share of 8%, others have 8%.
The largest suppliers of nuclear reactors for NPPs under construction are AREVA, a French company that supplies its reactors to Finland, France, China and the Great Britain, Russian companies Atomenergomash (AEM) and Atomstroyexport (JSC ASE) that supply reactors to Russia, Turkey, Belarus, India and Iran. These three companies account for 14%, 13% and 12% of the under-construction capacities, respectively. The share of Chinese companies is 21%, Korean companies account for 18% and the USA share is 10%. The remaining 12% are distributed among India, Japan, Germany, Czech Republic.
Conclusions
Nuclear energy plays an important role as part of the global energy sector, but its share in the energy balance is declining.
Further development will be concentrated in the following three segments.
1. In developed countries with existing nuclear energy facilities, most likely there will be a gradual decline in NPP electricity generation due to the closure of power units with expired service lives.
2. Developing countries with an established nuclear energy industry will be guided by the prospects of demand for electricity and the capabilities of NPPs to decarbonize the economy. The most rapid growth in NPP electricity generation will be in China and India.
3. The third segment is new countries where NPPs will be constructed for the first time. Such projects are the most risky and difficult to implement due to the need to create a
regulatory and management infrastructure, as well as the risks of implementing NPP projects in a new country, which can significantly delay the commissioning of new NPPs.
In world energy outlooks, the growth of nuclear energy is assumed at a level of 1-2% per year for the forecast period until 2040. This is higher than the expected growth rate of global energy consumption. However, taking into account the specifics of decision-making process regarding new projects at the level of governments, it is most likely that real development rates of the nuclear energy will be lower.
In the case of more ambitious targets of world economy decarbonisation, the role of nuclear energy increases. It seems that there are currently not enough new NPP projects for such scenarios. The attention of both the IAEA and market players should be focused on the development of such projects.
References
- Outlook for Energy: A perspective to 2040. // ExxonMobil, 2019.- URL: https://corporate.exxonmobil.com/-/media/Global/ Files/outlook-for-energy/2019-Outlook-for-Energy-data-pages. xlsx (09.10.2020).
- BP Energy Outlook 2019. – URL: https://www.bp. com/content/ dam/bp/business-sites/en/global/corporate/xlsx/energy- economics/energy-outlook/bp-energy-outlook-2019-chart- data-pack.xlsx (09.10.2020).
- Energy perspectives 2019. Equinor, 2019 // – URL: https:// www.equinor.com/content/dam/statoil/documents/energy- perspectives/equinor-energy-perspectives-2019-data-appendix. xlsx (09.10.2020).
- International Energy Outlook 2019. U. S. Energy Information Administration, 2019// – URL: https://www.eia.gov/outlooks/ ieo/pdf/ieo2019.pdf
- World Energy Outlook 2019, International Energy Agency, Paris, 2019.
- Global and Russian Energy Outlook, 2019. The Energy Research Institute of the Russian Academy of Sciences, Moscow School of Management SKOLKOVO, 2019. // – URL: https://energy.skolkovo.ru/downloads/documents/SEneC/Research/ SKOLKOVO_EneC_Forecast_2019_Rus.pdf (09.10.2020).
- Sky scenario, quantification and decision making. Shell, 2019 // – URL: https://s07.static-shell.com/content/dam/
royaldutchshell/documents/business-function/investor- relations/asia-pacific/sky-scenario-quantification-and-decision- making.pdf (09.10.2020). - Shell Energy Scenarios to 2050. Shell, 2011 // – URL: http:// www.proyectomilenio.org/documents/10156/43639/ Shell+Energy+Scenarios+2050+-Signals+%26+Singposts-. pdf?version=1.0 (09.10.2020).
- Shell scenarios, modelling and decision making. Shell, 2017. // – URL: https://www.shell.com/investors/news-and-media- releases/investor-presentations/2017-investor-presentations/ shell-scenarios-modelling-and-decision-making-webcast/jcr content/par/textimage_158f.stream/1504689440088/91af493 386941dc514eb 1c55d78eedf6f3a79017/scenarios-modelling- and-decision-making-presentation-new-york-6-september-2017. pdf (09.10.2020).
- International Energy Agency (2019) World Energy Outlook 2014 // OECD/IEA, Paris, 2014.
- «Techno-economic inputs» appendix for World energy outlook 2019 / Techno-economic inputs // – URL: https://www.iea.org/reports/world-energy-model/techno- economic-inputs#abstract (09.10.2020).
- Nuclear power reactors in the world. 2020 edition // International atomic energy agency, Vienna, 2020.